What the NAEP Results Mean for Arts Education

Photo by Allison Shelley for EDUimages
Since the release of the National Assessment for Educational Progress (NAEP) results, countless articles and analyses have revealed the same troubling trend: reading and math scores declined at an alarming rate for fourth and eighth grade students in the 2021-22 school year. Arts education practitioners may remember that these assessments include two questions that have been referred to as the “shooting star” of arts education research:
- Are you taking an art course this school year (for example, drawing, painting, or studio art)?
- How often do you participate in each of the following activities outside of school? Play an instrument and read music (student-reported): Never; Once/twice a year; Once/twice a month; Once/twice a week; Every day or almost.
There are several limitations to what these questions can offer researchers. They are quite vague and do not capture the breadth of disciplines within arts education. Reading music is not a precise measure of participation in music outside of the school day. But where these data are limited, they do offer an up-to-date look at arts education access that is comparable across states. Here are some of the findings for course taking in visual arts:
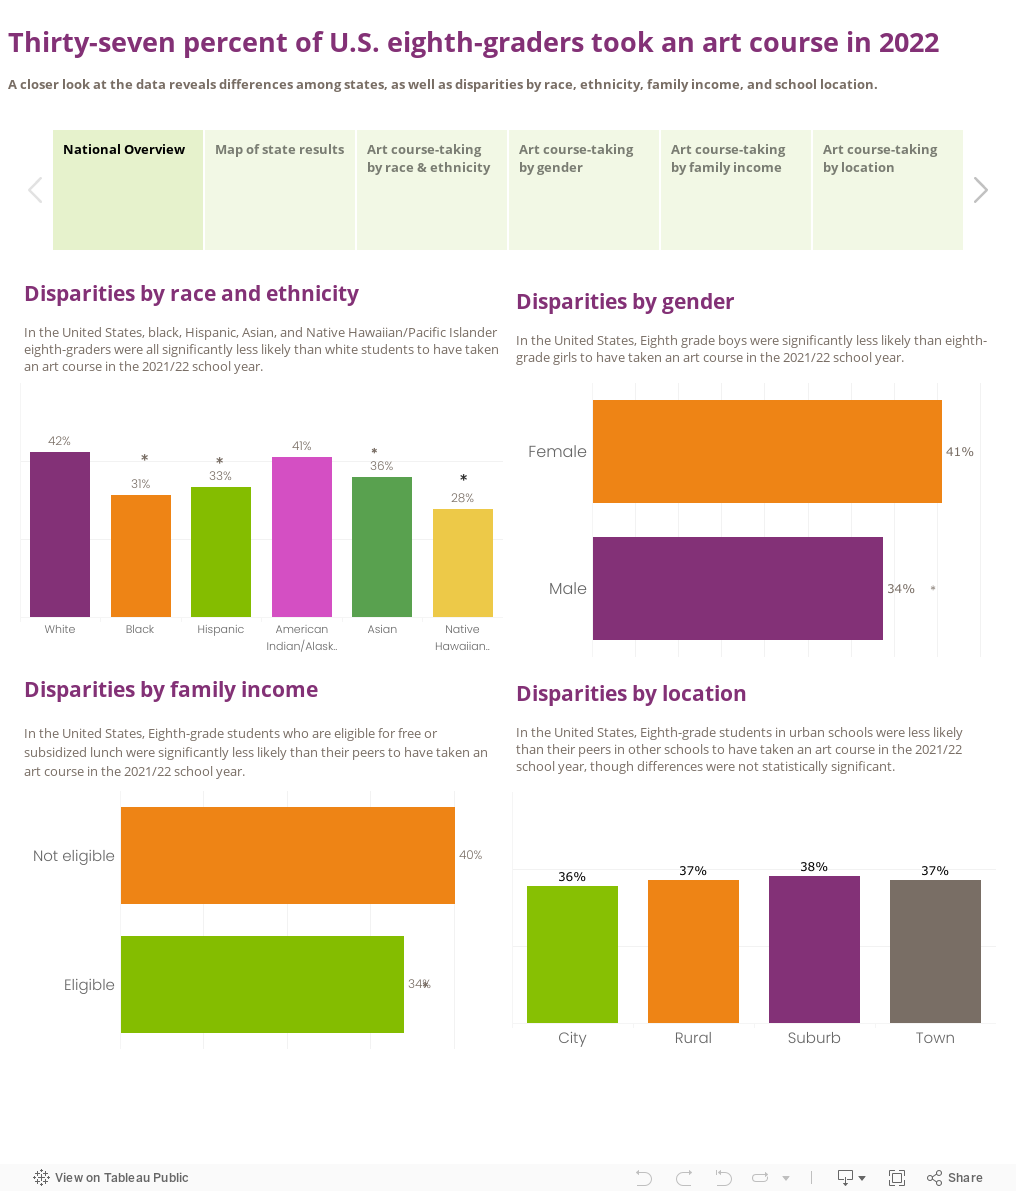
There was no overall change in students replying “yes” to the question of whether they were taking an arts course between 2019 and 2022. However, significant gaps exist between student groups:
- Black, Hispanic, Asian, and Native Hawaiian/Pacific Islander eighth graders were significantly less likely than white students to have taken an arts course in the 2021-22 school year.
- Compared to the 2018-19 school year, access for white students remained the same, while access dropped for Black students (34% to 31%).
- Asian students had a marginal increase in access to arts courses in 2021-22 (34% to 36%), though American Indian/Alaskan Native students saw the largest increase in access from 2018-19 to 2021-22 (32% to 41%).
- Disparities in access based on gender, family income and location saw little to no change from 2018-19 to 2021-22. Male students, students eligible for free/reduced-price school lunch, and students in city-located schools were less likely to have taken an arts course.
Now let’s take a look at the findings for music:
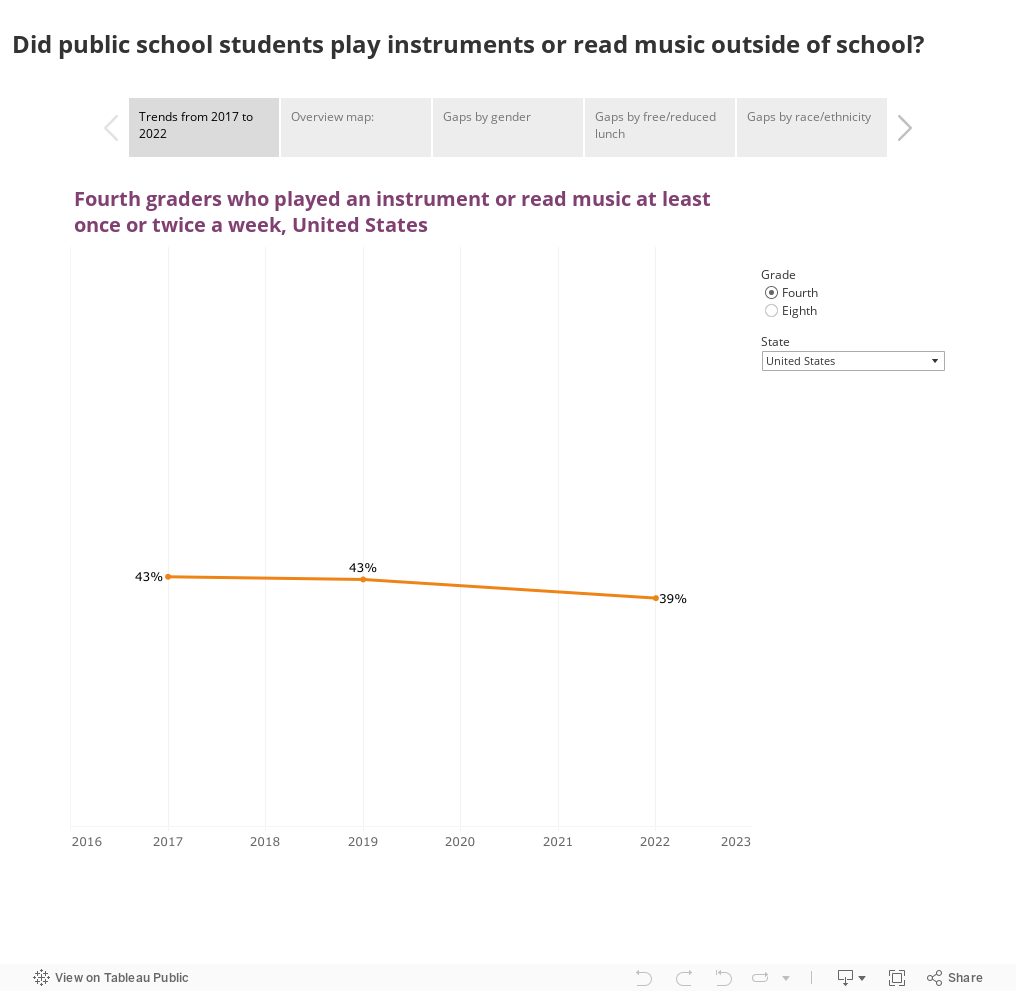
- The percentage of fourth and eighth graders playing an instrument or reading music outside of school declined from 2019 to 2022 (43% to 39% and 34% to 31% respectively).
- Female students continue to be significantly more likely than male students to participate in these activities in every state.
- Nationally, students who qualify for free/reduced-price school lunch are significantly less likely to play an instrument outside of school than students who do not qualify.
- Statistically significant differences among students of different racial groups and ethnicities who play an instrument outside of school emerged in 17 states from 2019 to 2022. Nationally, the largest significant differences exist between Asian students (45%) and every other racial group.
In the absence of the NAEP assessment for arts education, researchers and advocates are left to wonder: How were these questions developed, and can they be changed? Are some data better than none? The National Center for Education Statistics (NCES) details how the assessment is built and may provide greater insight into the origins of these questions. Any changes to the survey instrument over time presents challenges to identifying trends over time and is certainly a cost for advocates to weigh.
So now what?
In light of the results for reading and math, state leaders are grappling with how to improve outcomes for students in these two content areas. Time and time again, research has demonstrated that arts education benefits literacy and math skills, while also teaching students to be creative and empathetic problem solvers. AEP’s Arts Matter series demonstrates these outcomes in music, visual arts, dance and theatre.
We can anticipate that states will focus on leveraging resources from the American Rescue Plan’s Elementary and Secondary School Emergency Relief (ESSER) Funds to address these gaps to accelerate learning in these subject areas. We know that 24 states include arts in their ESSER plans, and as they implement these plans, AEP will continue to highlight districts who are using these funds to support arts programming. Weaving together the connections between research, practice examples—and yes, imperfect data—can help ensure that arts are a part of the solution.
*All demographic language in this post (age, gender, ethnicity, etc.) are reported using the student group categories used by the NAEP in their testing results.
Tableau data compiled by Claus von Zastrow.